Arcimoto Mean Lean Machine
Simulation & Validation Data
Accelerometer and tilt data collected on-vehicle before and after the suspension geometry changes, alongside Unity simulation screenshots of each evaluated condition.
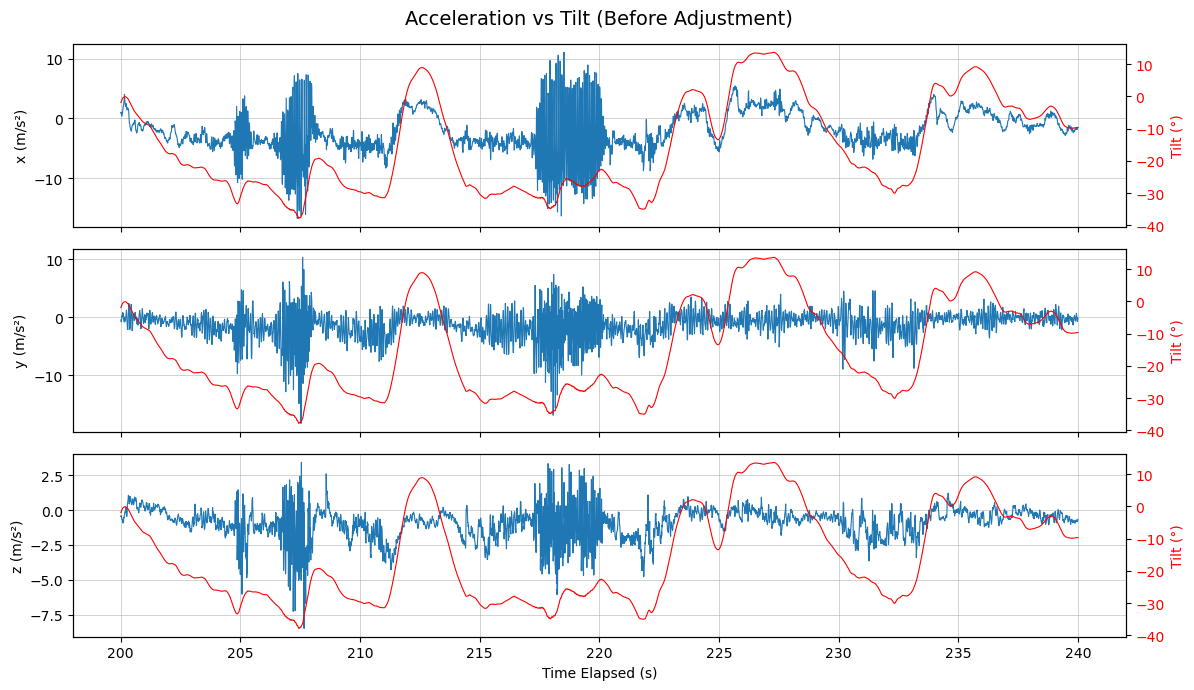
Vehicle Data - Before Adjustments
On-vehicle accelerometer (x, y, z) and tilt angle logged prior to any geometry changes. The instability event in this data corresponds to the geometry condition in Simulation A.
Unity Simulation - Geometry Comparisons
Screenshots from the Unity suspension-geometry simulator, showing three evaluated conditions. Each pair shows the original geometry (left) alongside the optimized output (right).
Simulation AGeometry condition corresponding to the steering instability event in the before data
Depicts instability condition - see FIG 01
Before
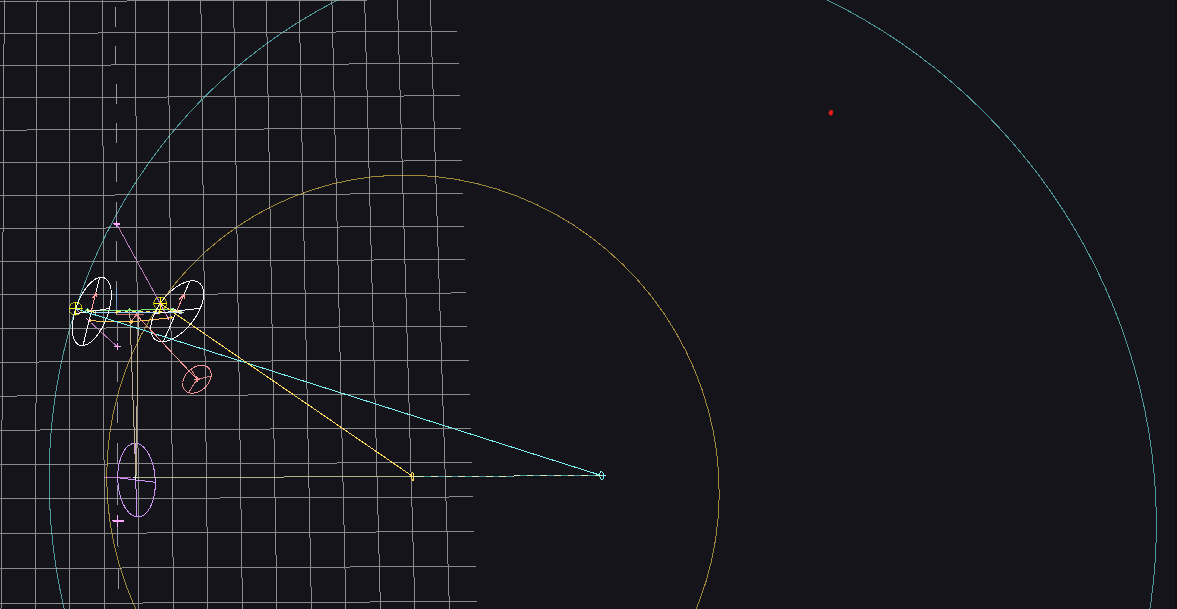
FIG 02A - Original geometry
After

FIG 02B - Optimized geometry
Simulation BSecondary geometry condition evaluated by the optimizer
Before
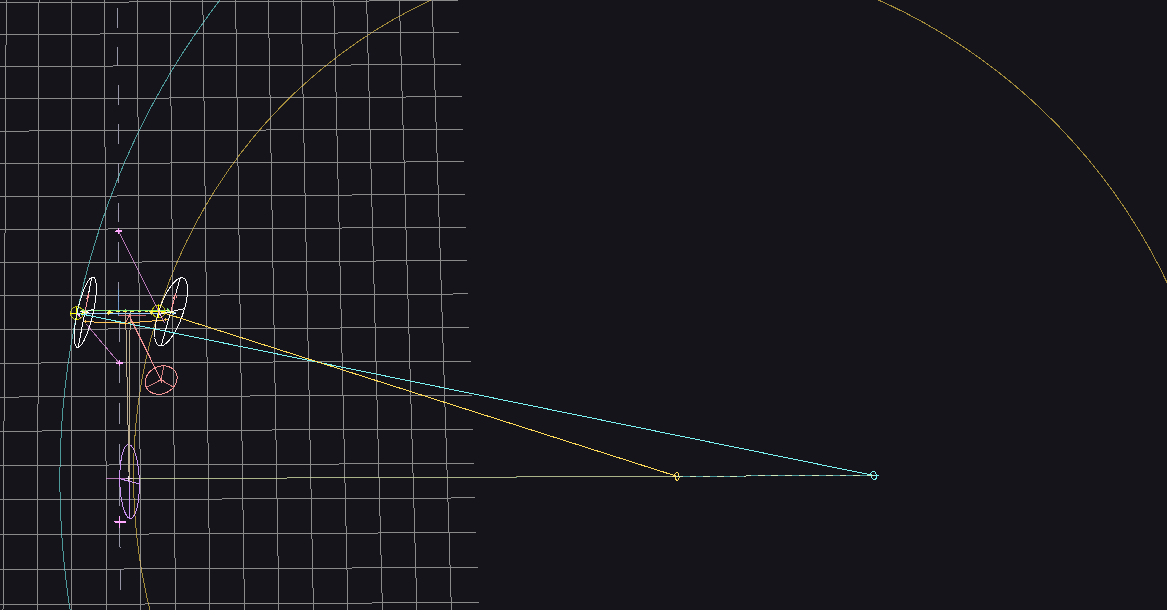
FIG 03A - Original geometry
After
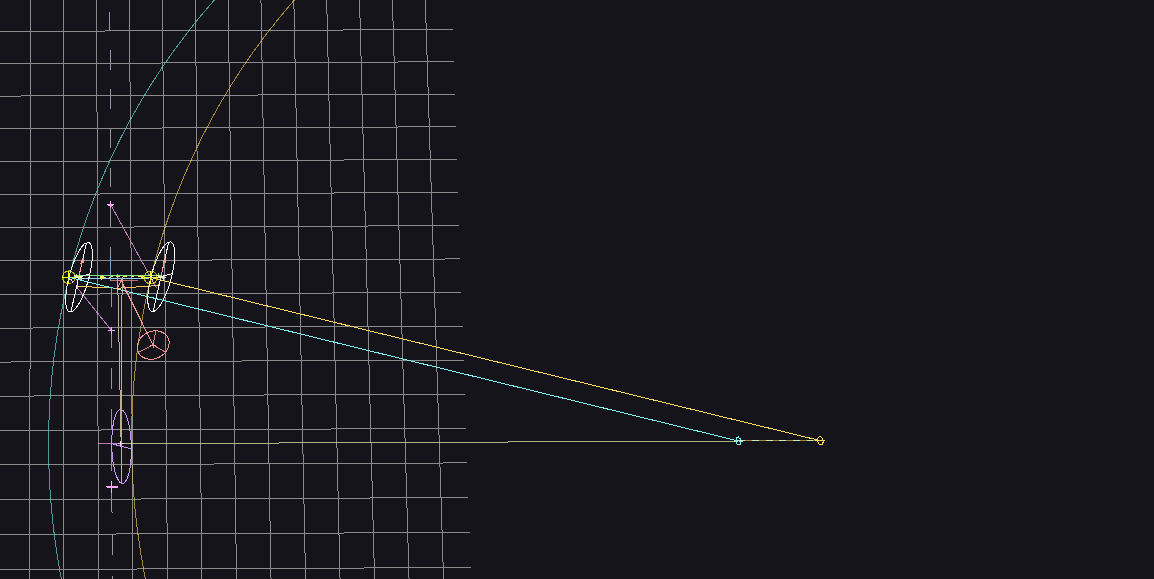
FIG 03B - Optimized geometry
Simulation CTertiary geometry condition evaluated by the optimizer
Before
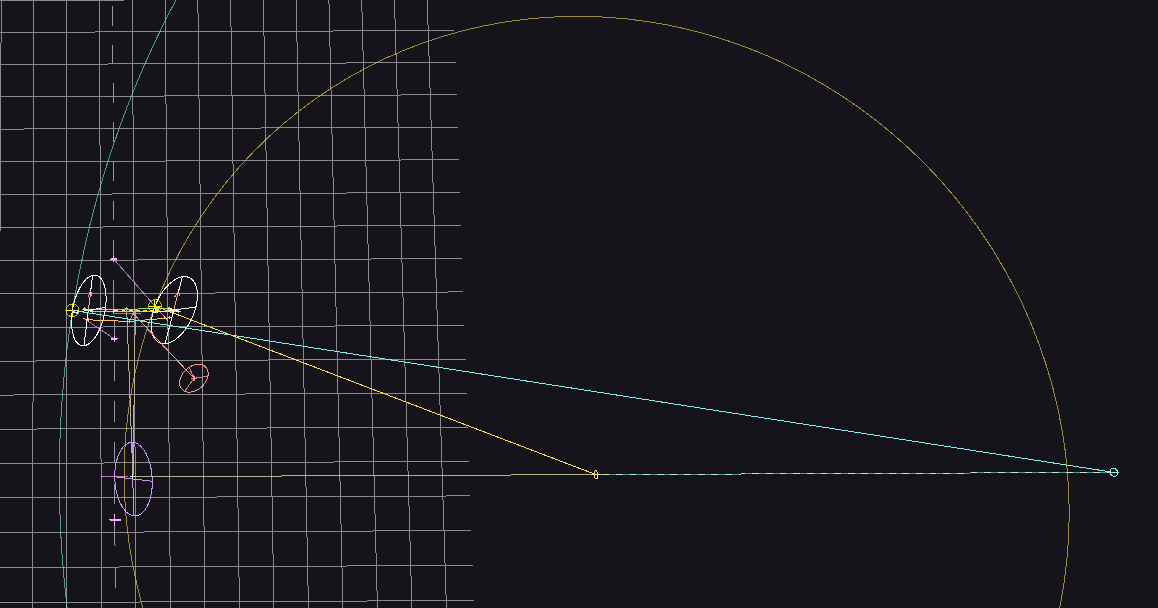
FIG 04A - Original geometry
After
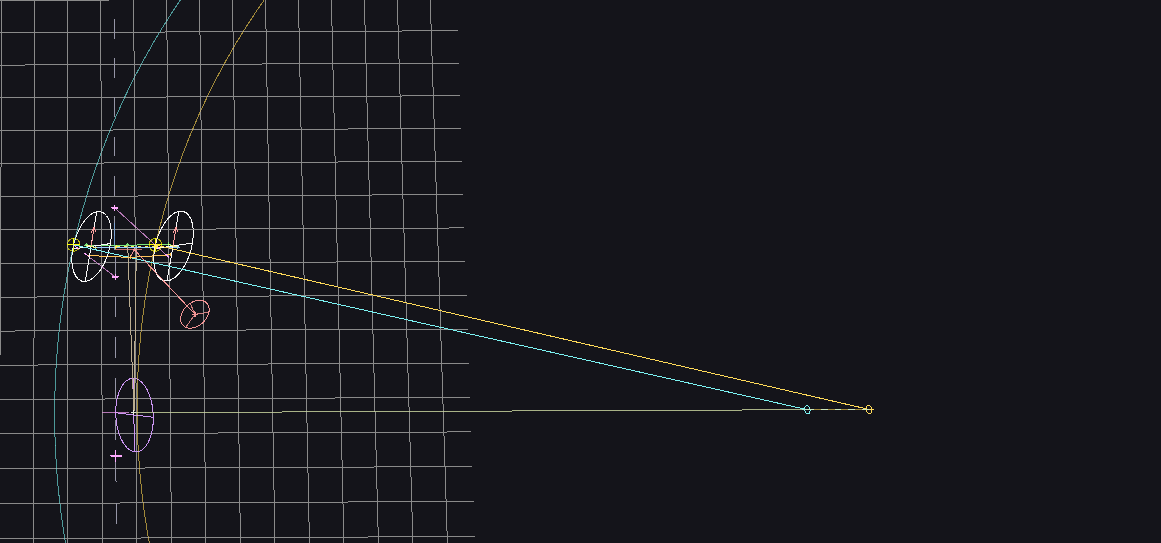
FIG 04B - Optimized geometry
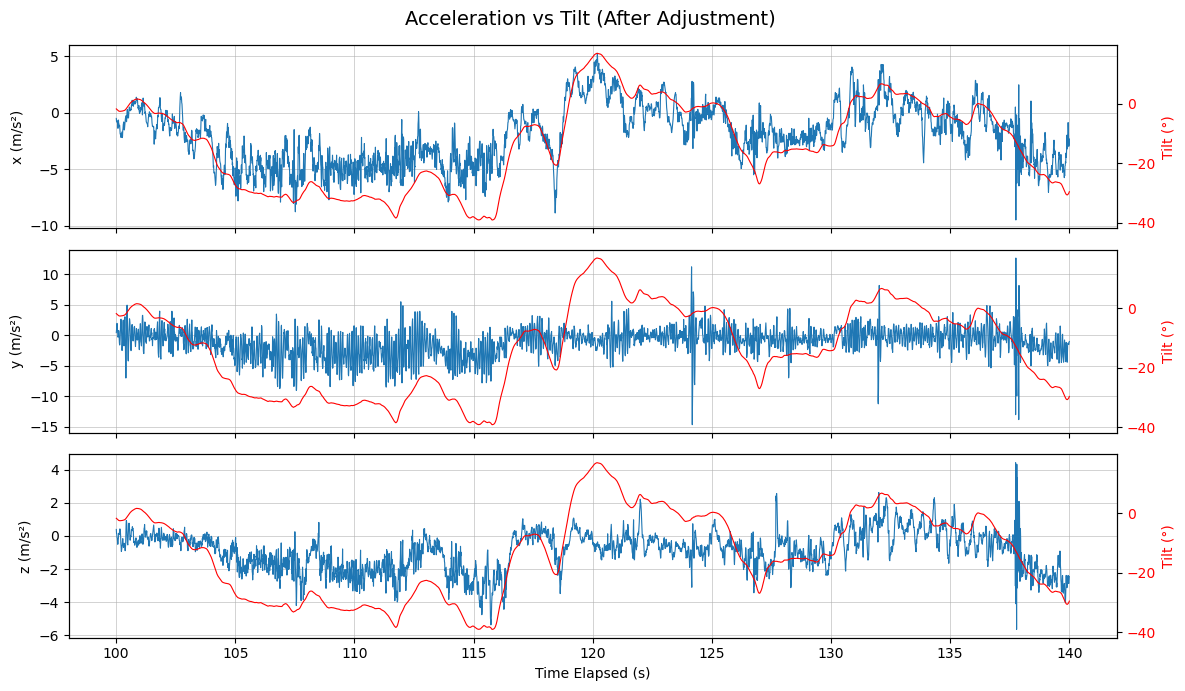
Vehicle Data - After Adjustments
Same test route logged after implementing the geometry changes. The instability event is absent; acceleration and tilt data are consistent with simulation predictions.